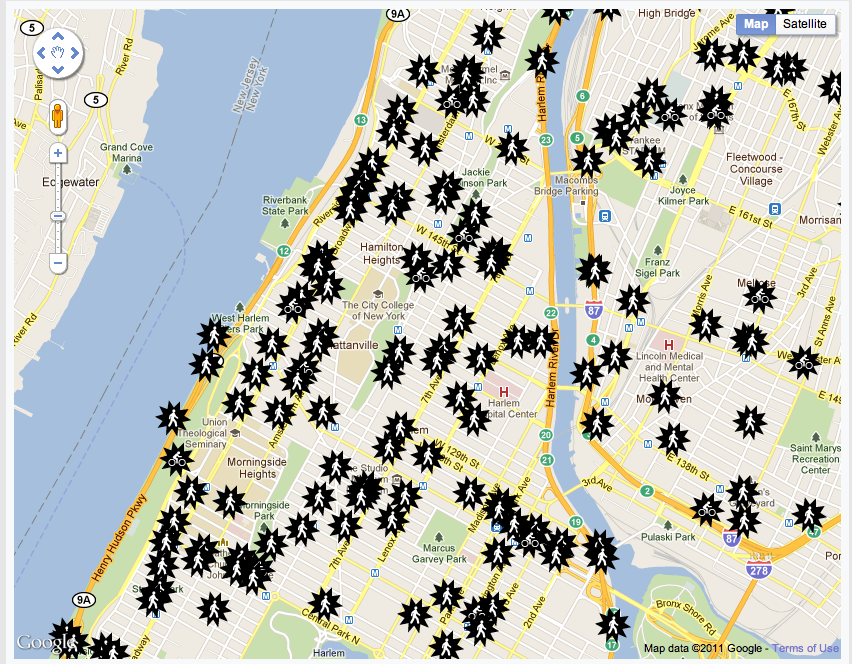
CrashStat by Transportation Alternatives provides an interactive map of NYC’s most dangerous intersections. Shown here are pedestrian and biker fatalities, Harlem, 1995 – 2009.
The site plots every crash recorded by the N.Y. State Department of Transportation since 1995 that involved a pedestrian or a bicyclist. Blue dots are pedestrian crashes, red are bicycle crashes, and the black stars–intentionally bold and eye catching– mark fatalities.
The site is extremely interactive allowing viewers to probe the database using any number of criteria: how many crashes have happened by year, by type of car, age of person hit, contributing factor, by neighborhood, community board, City Council district, NYPD precinct, a variety of geographic and political boundaries. You can also filter the crashes by contributing factors like age of pedestrian, or type of vehicle, of if speeding was involved. It also lets you see that crossing the street is getting safer in New York. Much of the data comes from the NYPD, which was ordered by a court to begin releasing crash data each month starting in June.
According to Transportation Alternatives Executive Director Paul Steeley: “By revealing where and why motor vehicle crashes occur, CrashStat gives all New Yorkers the information they need to demand better enforcement of our traffic laws”. He further states that speeding and failing to yield are the top most dangerous traffic behaviors of motorists, so that’s where he’d like to see enforcement focused.
This is a must have resource for any and everyone living in or visiting Harlem.